


Performance and Financial Highlights
(Millions of Yen)
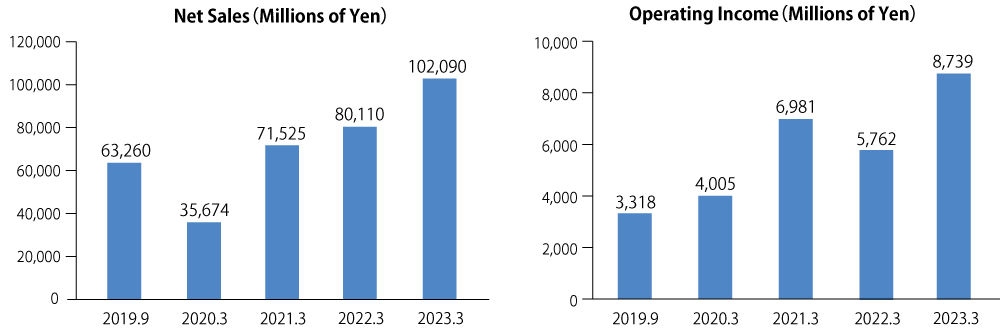
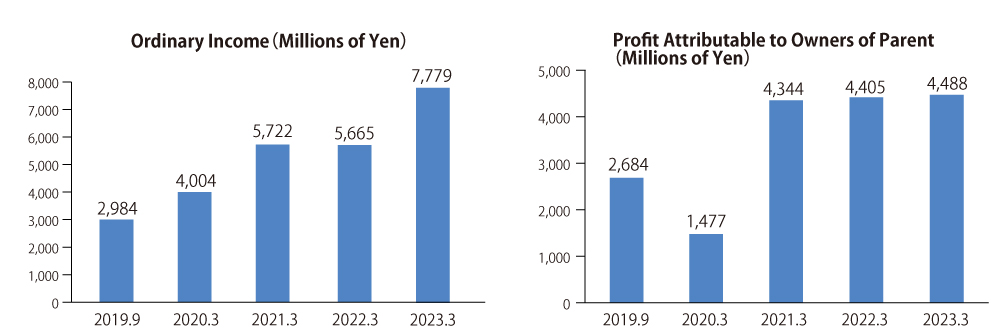
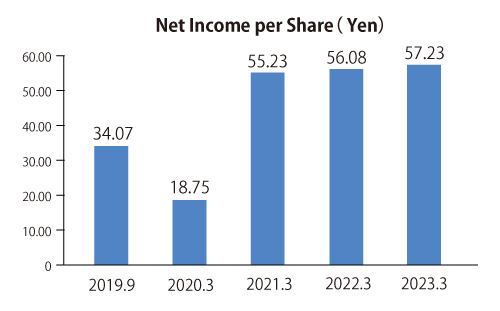
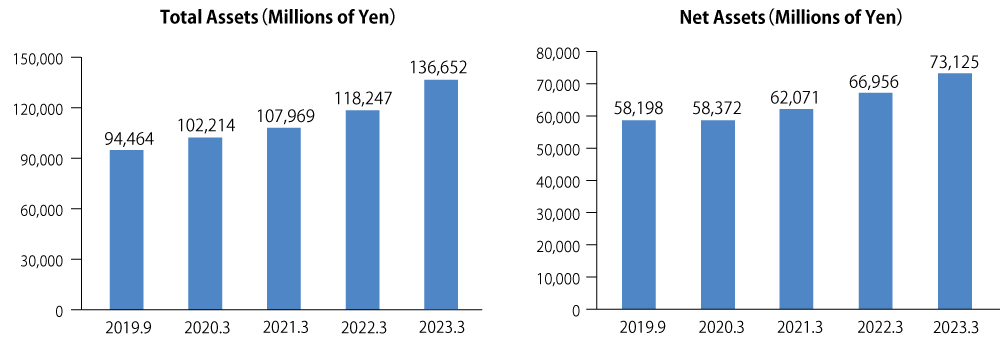
The fiscal year ended March 31, 2020 was an irregular 6-month fiscal term (due to a change in the fiscal year-end.)
| 2019.9 | 2020.3 | 2021.3 | 2022.3 | 2023.3 | |
|---|---|---|---|---|---|
| Net Sales | 63,260 | 35,674 | 71,525 | 80,110 | 102,090 |
| Operating Income | 3,318 | 4,005 | 6,981 | 5,762 | 8,739 |
| Ordinary Income | 2,984 | 4,004 | 5,722 | 5,665 | 7,779 |
| Profit Attributable to Owners of Parent | 2,684 | 1,477 | 4,344 | 4,405 | 4,488 |
| Net Income per Share | 34.07 | 18.75 | 55.23 | 56.08 | 57.23 |
| Total Assets | 94,464 | 102,214 | 107,969 | 118,247 | 136,652 |
| Net Assets | 58,198 | 58,372 | 62,071 | 66,956 | 73,125 |