


Performance and Financial Highlights
(Millions of Yen)
| 2022.3 | 2023.3 | 2024.3 | 2025.3 | 2026.3 | |
|---|---|---|---|---|---|
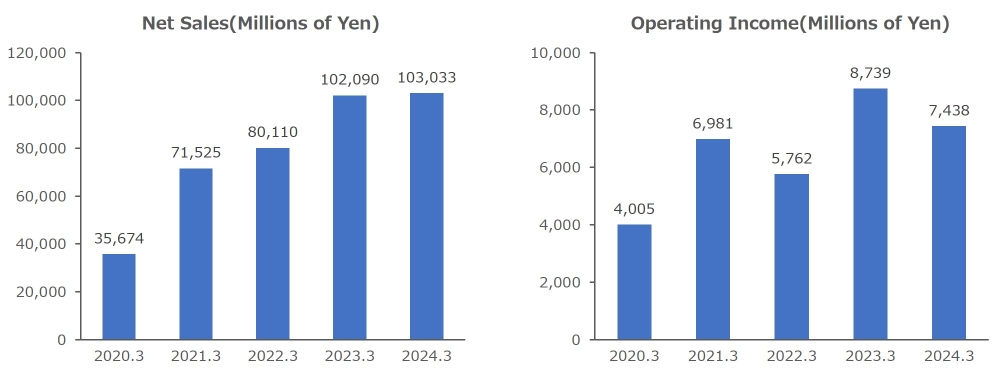
| Net Sales | 80,110 | 102,090 | 103,033 | 99,966 | 111,822 |
| Operating Income | 5,762 | 8,739 | 7,438 | 8,576 | 10,878 |
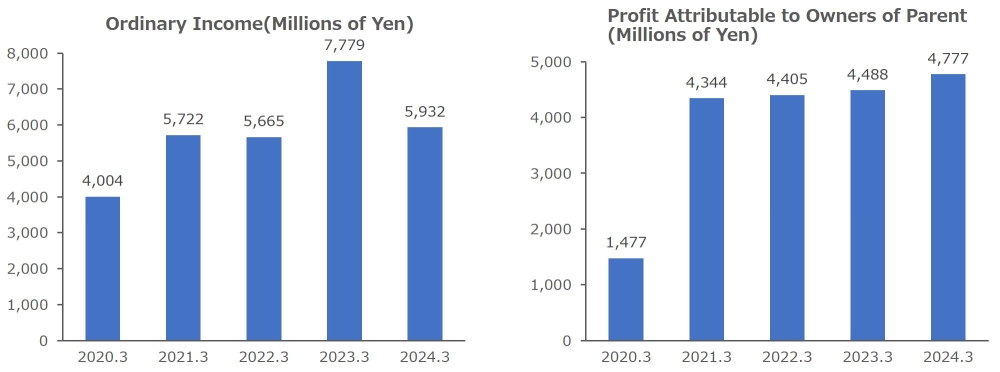
| Ordinary Income | 5,665 | 7,779 | 5,932 | 7,086 | 10,527 |
| Profit Attributable to Owners of Parent | 4,405 | 4,488 | 4,777 | 2,356 | 7,228 |
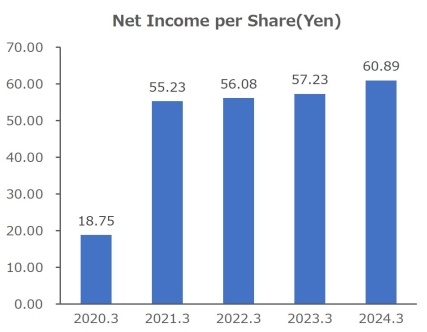
| Net Income per Share | 56.08 | 57.23 | 60.89 | 30.06 | 92.32 |
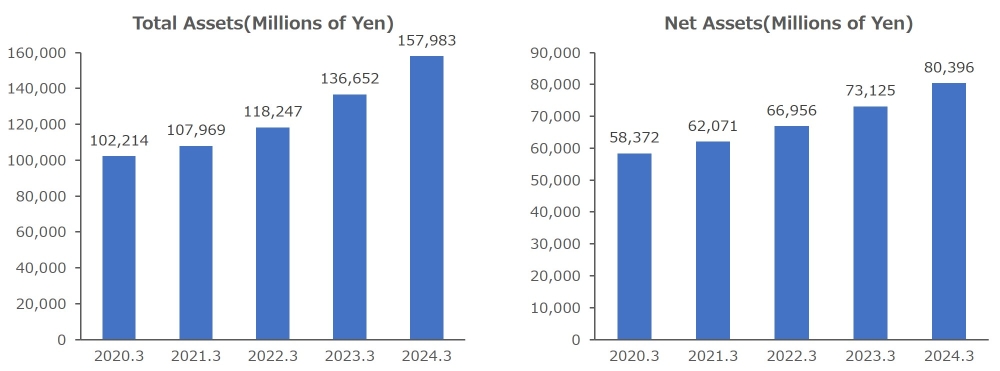
| Total Assets | 118,247 | 136,652 | 157,983 | 152,216 | 154,962 |
| Net Assets | 66,956 | 73,125 | 80,396 | 79,423 | 87,093 |