
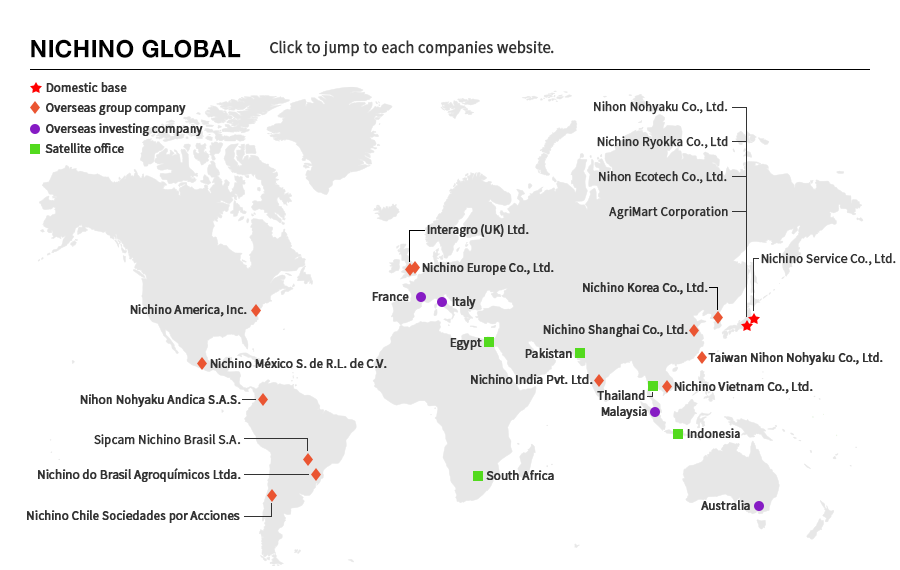


Response to Natural Capital and Biodiversity (TNFD)
- Response to Recommendations of the Taskforce on Nature-related Financial Disclosures (TNFD)
- Governance
- Risk and Impact Management
- Strategy
- Metrics and Targets
The SDGs call for biodiversity conservation and the sustainable use of natural capital as key elements. In line with this, the Kunming-Montreal Global Biodiversity Framework (GBF), adopted in 2022, sets the international goal of “nature positive” — placing nature on a recovery path by 2030.
Against this backdrop, the NICHINO Group will advance disclosures on nature-related risks and opportunities based on the recommended framework of the Taskforce on Nature-related Financial Disclosures (TNFD).
Recognizing the Group’s relationship with natural capital (forests, water resources, soil, biodiversity, etc.) in our business activities, we will address nature-related risks and opportunities as part of our sustainability initiatives.
Agrochemicals play an essential role in efficiently producing food from limited farmland. They support sustainable agricultural production across multiple dimensions: not only by preventing yield declines in response to rising food demand driven by global population growth and climate change, but also by addressing new pest and disease outbreaks associated with climate change, protecting crops during extreme weather events, and promoting the efficient use of soil and water resources. The Group will contribute to global food security through the development of environmentally conscious products and the provision of solutions.
Response to Recommendations of the Taskforce on Nature-related Financial Disclosures (TNFD)
Since our founding in 1928, the NICHINO Group has supported the development of a sustainable society by ensuring safe and steady food and improving the quality of life for all. Recognizing that agriculture both directly benefits from natural capital and can have non-negligible impacts on ecosystems, we announced our endorsement of the Taskforce on Nature-related Financial Disclosures (TNFD) Recommendations in March 2026. In line with these Recommendations, we aim to achieve a future in which the sustainability of food production and a nature-positive (nature restoration) trajectory coexist, by scientifically assessing the dependencies and impacts of our business activities on nature.
Governance
The NICHINO Group is enhancing sustainability management by deliberating and deciding on key issues in its business activities, including nature-related risks and opportunities, at the Board of Executive Officers chaired by the President and Representative Director.
The Board of Executive Officers also provides integrated oversight of activities related to sustainability, compliance, risk management, Responsible Care promotion, J-SOX, and nature-related issues. Matters decided are reported to the Board of Directors.
The Sustainability Committee evaluates nature-related risks and opportunities, monitors progress toward nature-related goals, and reports these results to the Board of Executive Officers.
Integration with the Human Rights Policy
The NICHINO Group fulfills its responsibility to respect human rights in addressing nature-related issues based on the NICHINO Group “Human Rights Policy” and “Basic Procurement Policy.”
Within the NICHINO Group's Philosophy Structure, the Sustainability Basic Policy—“Contributing to Food and Life through Technological Innovation”—is positioned as the foundation supporting the entire structure, from the Group's fundamental philosophy to its management policies and business plans. Based on this Philosophy Structure, the fundamental values that form the core of the “NICHINO Group Action Charter,” including “Compliance with Laws and Regulations,” “Social Contribution,” “Respect for Human Rights,” and “Safety First,” are consistently applied across natural capital management processes.
In addition, based on the NICHINO Group Green Procurement Standards, the Group requests that its business partners consider environment and human rights issues and promote responsible procurement practices throughout the entire supply chain.
Risk and Impact Management
The Risk Management Committee identifies various risks, including nature-related risks, and implements risk mitigation measures. It advances responses based on assessments of dependencies and impacts on natural capital, conducted in accordance with the TNFD Framework.
Strategy
The Group has implemented the following four-phase process of the LEAP approach recommended by the TNFD to comprehensively understand our dependence on and impact upon nature in our business activities and to develop a sustainable management strategy.
[Locate] Locating the Interface with Nature
Dependency and impact screening
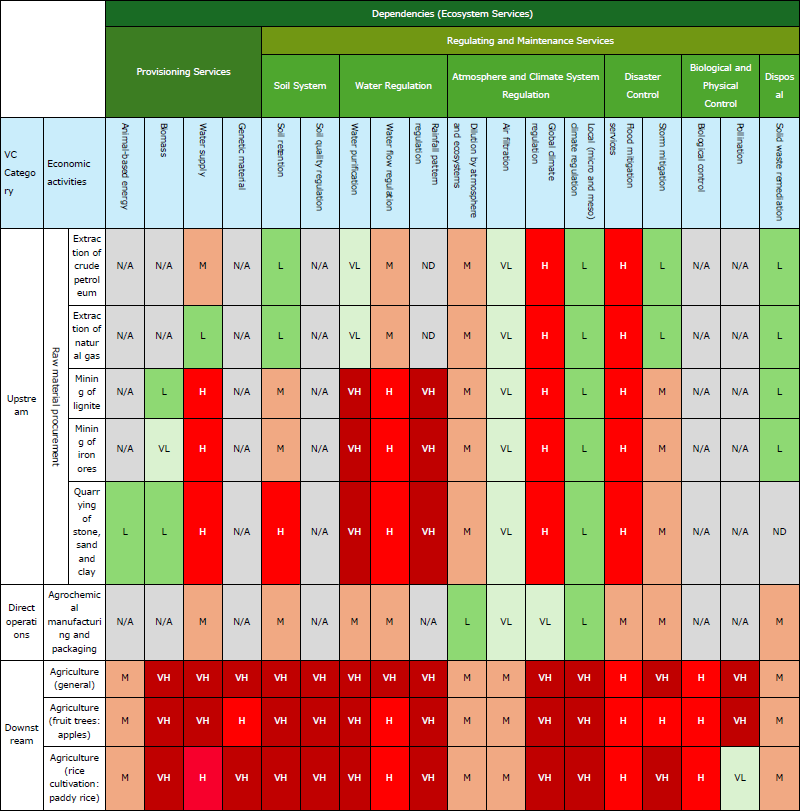
Our Group systematically assesses our dependencies and impacts on nature within our business activities by segmenting the entire value chain. We organize nature-related inputs (dependencies) and outputs (impacts) at each stage. Using ENCORE* analysis, we clarify at which stages our business activities most depend on and most impact natural capital. This analysis helps us identify priority locations for action. Specifically, the downstream “use (agriculture)” stage was found to exhibit significant dependencies on ecosystem services (pollination, pest control) and notable impacts on biodiversity. Additionally, direct operations (manufacturing sites) showed risks of water and soil pollution.
* ENCORE (Exploring Natural Capital Opportunities, Risks and Exposure): A tool developed by the United Nations Environment Programme World Conservation Monitoring Centre (UNEP-WCMC) to help assess dependencies and impacts of economic activities on natural capital on an industry-by-industry basis. It provides quantitative assessments of dependency levels (on a five-point scale ranging from Very High to Very Low) on 21 ecosystem services and impact levels from 14 environmental pressures, such as water pollution and land-use change, across more than 160 economic activities.
Dependency Assessment Results Based on ENCORE
Impact (Pressure) Assessment Results Based on ENCORE
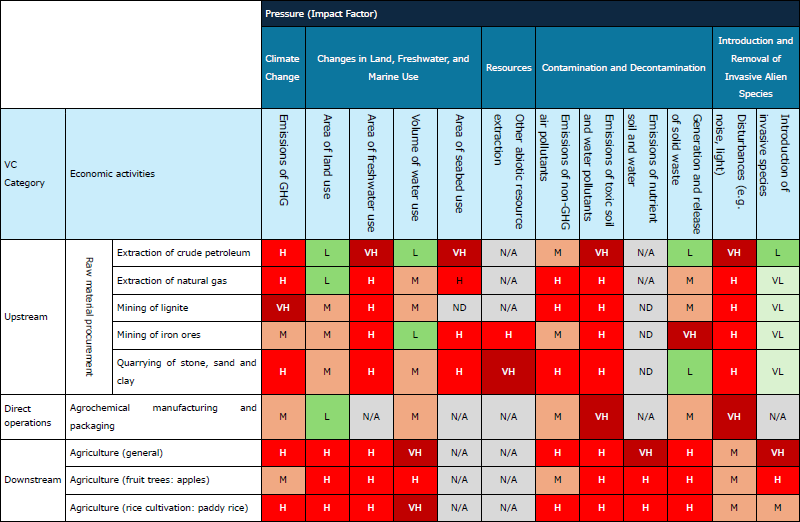
VH=Very High, H=High, M=Medium, L=Low, VL=Very Low, ND=Not Detected, N/A=Not Applicable
Based on the ENCORE assessment results, dependencies and impacts on natural capital were rated as “high” or “very high,” particularly in the agricultural sector. Accordingly, we defined our priority scope for assessment as our direct operations (three domestic manufacturing sites) and downstream agricultural sites. This scoping decision reflects not only the ENCORE assessment results but also a comprehensive consideration of the degree of manageability within our business activities and the impacts on stakeholders.
Identification of Priority Locations in Downstream Agriculture
Rationale for selecting agricultural sites as the evaluation scope:
- ENCORE assessment results: In the agricultural sector, risks to water quality and soil as well as impacts on ecosystems are anticipated to be the most significant.
- Risk concentration during use: There is potential for direct and indirect impacts on cultivated land and surrounding ecosystems (e.g., rivers and lakes) due to improper use.
- Addressing uncertainty: In line with TNFD’s emphasis on early risk identification, the scope covers unpredictable events arising from extreme weather events, such as runoff.
- Regulatory and reputational risk: Tightening regulations related to food security, combined with heightened public attention, could materially affect our business.
- Stakeholder scrutiny: This is a priority area for regulators and investors; transparent disclosure is expected to enhance trust.
- Data availability: We can leverage data from the Ministry of the Environment and the Ministry of Agriculture, Forestry and Fisheries, as well as research by relevant organizations (e.g., CropLife Japan).
The Strategic Importance of Aomori Prefecture
To enable an efficient evaluation in the fruit trees and paddy rice sectors, Aomori Prefecture was identified as a priority region for the following reasons.
- Japan accounts for the largest share of our sales, at 30%.
- Based on prefecture-level share rates*, Aomori Prefecture shows a particularly high level.
* CropLife Japan (CLJ) is an industry association for pesticide-related companies. The share rates presented in this document were independently calculated by the Company based on sales performance data of member companies and do not represent official data published by CLJ.
Product Use Concentration (Portfolio)
The sales share of our agrochemical products by application is highest for fruit trees, followed by paddy rice. These segments are key elements in our assessment of nature–related risks and opportunities. By strengthening our specialty crop*1 and paddy rice portfolios, we achieve strong alignment with our business strategy.
In the fruit trees sector, we offer a wide range of insecticides and fungicides. Product usage is concentrated in Aomori Prefecture, which accounts for 60% of Japan's apple production. This allows us to gain detailed insights into actual usage patterns during the approximately 12 agrochemical applications recommended annually. This geographical and crop-specific concentration enables us to efficiently promote environmentally conscious agriculture by leveraging the high affinity with IPM (Integrated Pest Management)*2 in apple cultivation.
In the paddy rice sector, we maintain a portfolio that is widely used across Japan. By introducing smart agriculture technologies, we create business opportunities to optimize agrochemical use and enhance productivity, thereby reinforcing alignment with our overall business strategy.
*1 Specialty Crops: According to the U.S. Department of Agriculture (USDA) definition, specialty crops are those grown for food or ornamental purposes, such as fruits, vegetables, nuts, flowers, and herbs. In contrast, row crops are staple crops suited to mechanized cultivation, such as corn, soybeans, wheat, and cotton.
*2 IPM (Integrated Pest Management): An approach that combines multiple control methods, rather than relying solely on chemical pesticides, to keep pest and disease pressures below economically damaging levels.
Narrowing down specific priority locations within Aomori Prefecture
In Aomori Prefecture, priority locations were selected for apple orchards and paddy rice fields based on three criteria:
(1) overlap with Key Biodiversity Areas (KBAs)*, such as the Shirakami Mountains and the Byobu Mountain Wetlands;
(2) flood-prone zones; and
(3) landslide hazard zones.
Three locations were selected for apple orchards and three for paddy rice fields, resulting in a total of six priority locations.
The purpose of this selection is to identify representative sampling locations where the distribution channels and actual use patterns of our products can be readily understood. In addition, within the Assess phase of the LEAP approach, we conduct qualitative scenario analysis to evaluate potential impacts in the event that physical risks, such as agrochemical leakage associated with climate change or natural disasters, were to materialize. Through this process, we aim to strengthen preventive risk management measures.
* KBA (Key Biodiversity Area): Areas designated based on scientific criteria established by the International Union for Conservation of Nature (IUCN) to identify regions of global importance for biodiversity conservation. These include habitats of endangered species and areas with high concentrations of endemic species.
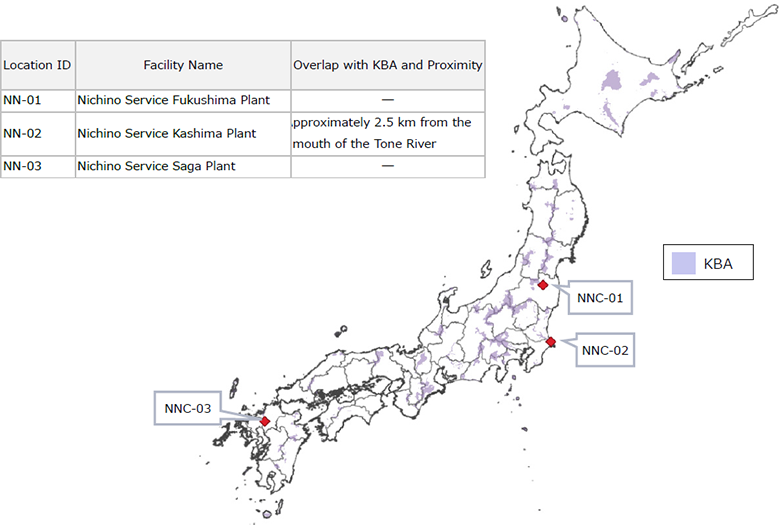
Identification of Priority Locations for Direct Operations (Manufacturing Sites)
For risk assessment in direct operations, we have designated our three domestic manufacturing sites as priority locations.
[Evaluate] Evaluating Dependencies and Impacts
To clarify the causal relationship between business activities and natural capital in priority locations, we conducted an analysis of “Dependency and Impact Pathways” survey.
We performed detailed investigations at six identified priority locations (three apple orchards and three paddy rice fields), as well as three domestic manufacturing sites directly operated by the Company, based on ENCORE assessment results and environmental impact data from product SDSs (Safety Data Sheets).
The tools and data used are as follows:
| Evaluation Criteria | Data/Tools Used | Activities Performed |
|---|---|---|
| Quantitative Assessment of Dependencies and Impacts | ENCORE | Activity-specific ecosystem service dependency and environmental pressure assessment (VH~VL) |
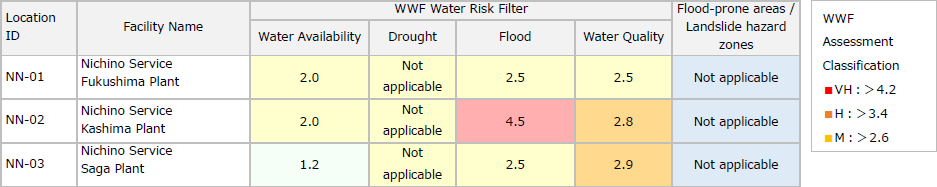
| Water Risk Assessment | WWF Water Risk Filter*1 | Quantitative assessment of physical, regulatory, and reputational risks related to water |
| Biodiversity Risk Assessment | WWF Biodiversity Risk Filter*1 | Impact assessment on biodiversity hotspots surrounding the site |
| Environmental Impact of Products | Product SDS (Section 12: Ecological Information) | Organization of environmental impact data including aquatic toxicity, biodegradability, and soil adsorption |
| Physical Risks | Ministry of Land, Infrastructure, Transport and Tourism “Overlay Hazard Map” | Identification of climate change-related physical risks (flood-prone zones, landslide hazard zones) in each priority location |
| Protected Area Applicability | IBAT*2 | Confirmation of applicability to IUCN protected areas*3. |
For physical water risks, screening was conducted using the WWF Water Risk Filter. Subsequently, flood and landslide risks were assessed using overlay hazard maps, and no applicable risks were identified.
This analysis clarified the pathways of dependency and impact in priority areas, comprehensively identifying nature-related risks and opportunities. This forms the foundation for prioritization and scenario analysis in the next phase, Assess (risk and opportunity assessment).
*1 WWF Water Risk Filter (WRF) / WWF Biodiversity Risk Filter (BRF): Risk assessment tools provided by the World Wide Fund for Nature (WWF). The WRF quantitatively assesses physical, regulatory, and reputational water-related risks at business locations based on regional characteristics, while the BRF quantitatively assesses biodiversity importance and the impact level of business activities based on regional characteristics.
*2 IBAT (Integrated Biodiversity Assessment Tool): An online tool that visualizes areas that are important for biodiversity—such as protected areas and habitats of endangered species—as geographic information, enabling assessment of the impacts of business activities on the natural environment.
*3 IUCN Protected Areas: Protected areas defined by the International Union for Conservation of Nature (IUCN), classified into six categories based on management objectives: Ia (Strict Nature Reserves) to VI (Protected Area with Sustainable Use of Natural Resources). Approximately 200,000 sites worldwide are registered, serving as an international benchmark for biodiversity conservation.
[Assess] Assessing Risks and Opportunities
Overview of the Assessment Process
We conducted a qualitative assessment based on the two criteria described below and prioritized the list of nature-related risks and opportunities identified during the Evaluate phase. The assessment drew on past cases, industry benchmarks, and the results of stakeholder interviews.
Risk and Opportunity Assessment Criteria
The assessment criteria are as follows.
| Assessment Criteria | Rating | Score | Definition | |
|---|---|---|---|---|
| Impact on the Company | Financial Impact | High | 30 pt | Over 1 billion yen |
| Medium | 20 pt | Approximately 30 million to 1 billion yen | ||
| Low | 10 pt | Under 30 million yen | ||
| Likelihood of Occurrence | High | 30 pt | Once a year or more | |
| Medium | 20 pt | Approximately once every three years | ||
| Low | 10 pt | Once every ten years or less | ||
| Impact on and Level of Interest of Stakeholders (Evaluated for each of the five stakeholder groups: customers, suppliers, government authorities, investors, and local communities) |
High | 30 pt | Significant impact (high level of interest) | |
| Medium | 20 pt | Moderate impacts (moderate level of interest) | ||
| Low | 10 pt | Limited impacts (low level of interest) | ||
Importance Classification Based on Overall Score
| Overall Score Range | Rating | Explanation |
|---|---|---|
| 41–60 pt | High | High Priority: Risks and opportunities requiring priority action |
| 21–40 pt | Medium | Medium Priority: Requires ongoing monitoring |
| 1–20 pt | Low | Low Priority: No significant concerns at this time |
- Impact on the Company (A): (Financial Impact + Likelihood) ÷ 2 (maximum score: 30 pt)
- Impact on and Level of Interest of Stakeholder (B): The highest score among the five stakeholder groups is adopted (maximum score: 30 pt)
- Overall Score: A + B (maximum score: 60 pt)
Through this two-axis assessment, we identified risks and opportunities requiring priority action from both financial and social importance perspectives.
Scenario Analysis
In the scenario analysis (Assess), we adopted two scenarios from the TNFD-recommended “four-quadrant scenarios” and conducted an exploratory assessment of nature-related risks and opportunities. The scenarios were selected with a focus on consistency, enabling a comprehensive understanding of the interactions between climate change and natural capital, given that climate change scenario analysis based on the TCFD had already been conducted. Furthermore, from the perspective of efficiency in exploratory analysis, we adopted two contrasting scenarios #1 (Quadrant 1: Orderly Transition) and #3 (Quadrant 3: Delayed Response/High Impact) to effectively capture the range of uncertainties. In addition, as an initial TNFD response, we focused on identifying priority risks and opportunities through qualitative assessment, taking into account practicality to establish a foundation for future detailed evaluations.
The assessment results are as follows.
[Prepare] Preparing to Respond and Report
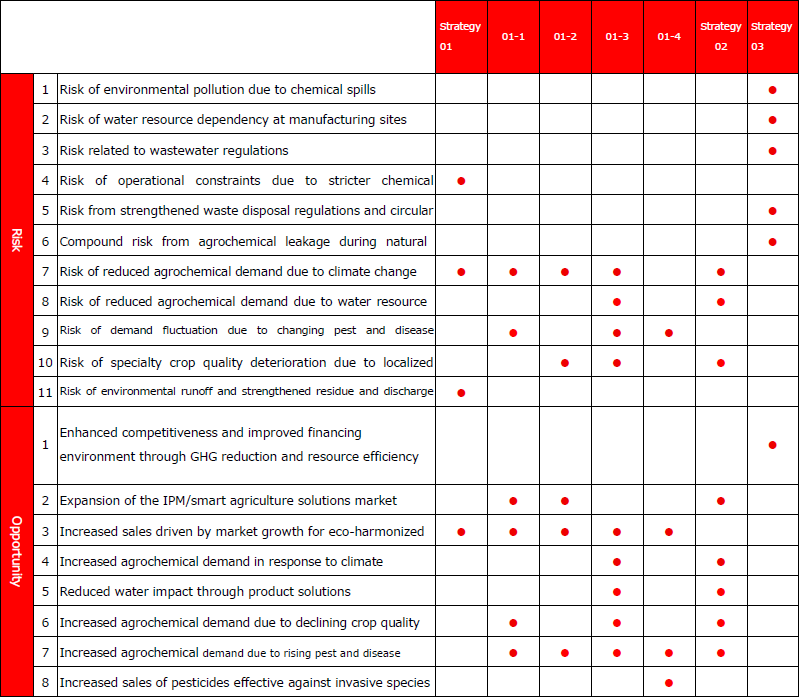
Nature-Related Risks and Opportunities and Response Measures by Strategy
Through the LEAP approach, we identified nature-related risks and opportunities and examined their alignment with the Group's existing strategies. As a result, we confirmed that many of the response measures are linked to our current strategies. With respect to risks, we will steadily implement specific measures aimed at minimizing their potential impact on our business. For opportunities, we will proactively promote initiatives to strengthen our competitive advantage and contribute to the creation of new values. Furthermore, to ensure the effectiveness of our strategy-specific response measures, we will establish and monitor relevant KPIs, driving continual improvement through the PDCA cycle.
The table below summarizes the identified nature-related risks and opportunities and their relationships with corresponding strategies.
【Strategy 01】Expanding the Adoption of Eco-Harmonized Products (Enhancing the Product Portfolio)
- Strengthened development of new products with high safety and environmental considerations
- Global sales expansion of eco-harmonized products
- Improvement of R&D infrastructure and promotion of acquisition of rights for biopesticides, biostimulants, etc.
| KPI (Key Performance Indicators) and targets | As a research and development-oriented company, the Nichino Group promotes technological innovation and develops new products with a high level of safety and environmental considerations. We invest approximately 10% of standalone sales (approximately 7% on a consolidated basis) annually in R&D, with a planned cumulative investment of 20 billion yen over the three-year period of the current mid-term management plan. Sales target for eco-harmonized products:39.3 billion yen (FY2026) |
|---|
【01-1】Promotion of Integrated Pest Management (IPM) and Crop Protection Solutions
- Provision of integrated pest and weed management solutions
- Integration with pest and disease occurrence prediction systems
- Strengthening of business expansion into crop protection products sector
【01-2】Provision of biopesticide and biostimulant products
- Market launch of biopesticide and biostimulant products in multiple regions
- Research and development of microbial pesticides, pheromone agents, etc.
【01-3】Research and development, promotion, and sales of products adapted to climate change
- Research and development of climate-resilient agrochemicals (weather resistance, persistence)
- Formulation design maintaining efficacy under extreme weather conditions
- Product development for varieties and cultivation systems adapted to climate change
- Development and facilitation of registration for water-saving technologies (formulations compatible with low-volume spraying)
- Monitoring and response to domestic and international regulatory trends
- Product deployment addressing region-specific needs
【01-4】Response to Invasive Species
- Research and development of products for invasive species control
- Research and development of products addressing invasive species expansion due to climate change
- Provision of invasive species control products (e.g., countermeasures against invasive ant damage on Hachijo Island)
【Strategy 02】Providing Smart Agriculture Products and Services
- Expansion of functionalities and global deployment of the smart agriculture platform “Reimi AI Disease, Pest, and Weed Diagnosis,” branded as “AcroSeeker” for global markets
- Provision of agricultural solutions utilizing AI digital technology (e.g., AI pest and disease occurrence prediction)
- Research and development of products for precision agriculture and water-saving agriculture
- Market development for products targeting water-scarce regions
- Download the free “Reimi AI Disease, Pest, and Weed Diagnosis” app here
- Our Commitment to Smart Agriculture
| Actual Figures | App Downloads:Domestic: 290,000; Overseas: 90,000; Total: 380,000 (as of December 2025) |
|---|
【Strategy 03】Enhancing Competitiveness through Resource Efficiency and GHG Reduction
- Improvement of production efficiency and promotion of energy conservation measures
- Expansion of renewable energy adoption (solar power generation, etc.)
- Promotion of a shift to packaging materials using biomass ink
- Reduction of plastic usage through product specification changes
- Promotion of green purchasing, such as recycled plastics
- Continuation of initiatives toward achieving GHG emissions reduction targets (Scopes 1, 2, and 3)
- Optimization of the supply chain through local production (reducing CO2 emissions from transportation)
- Engagement in research and development of manufacturing technologies to reduce GHG emissions
| KPI (Key Performance Indicators) and Targets | Scope 1 + 2 GHG Emissions Reduction Target:TCFD Metrics and Targets (GHG Emissions Reduction Initiatives)
We aim to achieve a 23 % reduction for the entire Group*1from 2020 levels (Scope 1*2+2*3)in 2030, and achieve carbon neutrality in Japan and Brazil in 2050. (In India, our target is 2070 due to the national policies.) *1 NIHON NOHYAKU CO., LTD. and other Group companies that have manufacturing sites in Japan and overseas. We have manufacturing sites in Japan, India, and Brazil.
|
|---|
Metrics and Targets
The Nichino Group discloses the following core global metrics recommended by the TNFD, along with organization–specific metrics and targets.
TNFD Core Global Indicators and Metrics (Actual Results)| TNFD Core Global Disclosure Indicators and Metrics* | Our Group Initiatives | |||
|---|---|---|---|---|
| Metric no. | Drive of nature change | Indicator | Target of Initiatives | Reference for Actual Data |
| — | Climate change | GHG emissions | GHG emissions reduction Total GHG emissions (Scope 1, 2, 3) Fugitive emissions of fluorinated gases |
Sustainability Data Book |
| C1.0 | Land/freshwater/ ocean-use change | Total ecosystem footprint (area under management/control) | Land area of major domestic and overseas sites | Securities Report |
| C2.0 | Pollution / pollution removal | Pollutants released to soil | Emissions and transfers of PRTR-listed substances | Sustainability Data Book |
| C2.1 | Wastewater discharged (volume, pollutant concentration, temperature, etc.) | Volume of water discharged, COD discharged, BOD discharged | Sustainability Data Book | |
| C2.2 | Volume of waste generated, finally disposed of, recycled | Volume of industrial waste generated, finally disposed of, recycled | Sustainability Data Book | |
| C2.4 | Major air pollutant emissions (NOx, SOx, soot and dust, etc.) | Nitrogen oxides, Sulphur oxides, soot and dust | Sustainability Data Book | |
| C3.0 | Resource use / circular economy | Water withdrawal and consumption from water-stressed areas (including identification of water sources, etc.) | Water withdrawal | Sustainability Data Book |
| Initiatives | Targets | Actual Results |
|---|---|---|
| Sales of Eco-Harmonized Products | 39.3 billion yen (FY2026) | 37.3 billion yen (FY2025),34.7 billion yen (FY2024) |
| R&D Expenditures/Ratio | 20.0 billion yen (FY2024–2026) | 7.8 billion yen (FY2025),6.3 billion yen (FY2024) Approximately 10% of standalone sales (7% on a consolidated basis) (average over the last 10 years) |
| Percentage of Renewable Energy in Electricity Consumption | Nichino Service Fukushima: 100%; Kashima: 6.7%; Saga: 99.8% (FY2025) | |
| AI App Downloads | Domestic: 300,000; Overseas: 100,000; Total: 400,000 (March 2026) |
